Wastewater Epidemiology: Reading Community Health Trends from Sewers
Beneath city streets, pipes quietly collect biological clues that reveal how infections move through populations. By examining what communities flush away, researchers can spot early indications of outbreaks, compare patterns across neighborhoods, and support timely decisions. The approach relies on pooled signals from many people, which keeps attention on group patterns rather than individual identities.
This story is part of DailySeekers's practical reading library across everyday topics.
What Sewers Reveal About Local Illness Patterns
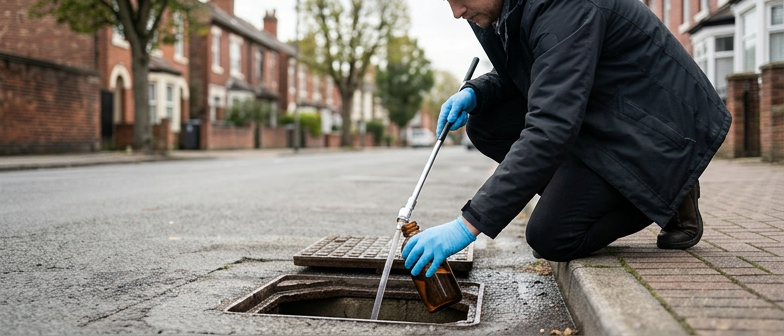
Walking past a manhole cover, it is hard to imagine it as a health data point. Toilets, sinks, and showers in a catchment area drain into shared pipes, mix together, and form one large pooled sample. By examining that mixed flow, specialists can look for tiny traces of viruses, bacteria, and other biological markers that reflect how much illness is circulating.
Because the sample represents everyone who contributed to the system, it also reflects people who never visit a clinic, use home tests only, or have no symptoms at all. Instead of waiting for people to feel unwell, seek care, and be recorded, the underground network simply collects what is already being flushed away.
Patterns that emerge from underground signals
In practice, laboratories filter samples and test them for genetic material from different microorganisms. Respiratory agents, stomach bugs, and other infections can all leave detectable fragments behind. When those signals rise or fall over time, they sketch out trends in how strongly a pathogen is circulating in that area.
A steady increase over several sampling days may point to growing transmission. Sharp spikes may align with events, holidays, or shifts in local behavior. When several targets are tracked at the same time, it becomes possible to see which infections dominate a season and which are fading. Local health teams can then use those trends, together with other information such as clinical diagnoses, to adjust communication or plan staffing.
A helpful way to think about these signals is as an additional line on the same chart as clinic data and community surveys: not a replacement, but a complementary view.
From Manhole to Lab Bench: How Samples Become Signals
From a street-level view, collecting from underground pipes looks simple: lift a cover, dip a bottle, send it away. In reality, a lot of quiet work happens between that first scoop and the final curve on a dashboard.
Capturing a representative sample
Waste flowing through pipes is constantly changing. Morning showers, work hours, evening cooking, and nightlife all shift what passes a sampling point. To avoid chasing random bursts, teams often use automatic samplers. These devices collect small portions at regular intervals and pool them into a composite sample that better reflects several hours instead of a single moment.
Samples are kept cold and transported without delay, because some targets can degrade over time. Clear labels, sealed containers, and straightforward security steps lower the risk of mix‑ups or tampering during collection and transport.
The goal is consistency: taking samples in similar ways, at similar locations, and on a regular schedule so that changes in the numbers are more likely to reflect real shifts in community conditions rather than quirks in how the sample was collected.
Turning murky water into readable data
In the lab, the main challenge is to concentrate faint signals from a relatively large volume. Technicians may spin samples at high speed or filter them, pulling out solids where many microbes and genetic fragments stick. Chemicals are added to break open cells and release their contents into solution.
From there, specific genetic sequences can be copied and counted with sensitive instruments. Control materials are run in parallel to check that the process is working and that background contamination is low. The resulting values are then interpreted with context: how much flow passed the sampling point, how results compare with previous days, and whether any unusual handling steps occurred.
One helpful way to frame the workflow is as a chain of decisions, each of which shapes the quality of the final signal:
| Step in the chain | Key practical question | Typical trade‑off for teams |
|---|---|---|
| Choosing a site | Does the location reflect the population of interest? | More focused areas give detailed signals but can raise privacy and equity concerns; larger catchments are more anonymous but blur local variation. |
| Setting a schedule | How often can samples realistically be collected? | Frequent sampling gives timely curves but requires more staff time and lab capacity; less frequent sampling is easier to sustain but may miss short‑lived changes. |
Making Sense of Wiggly Curves
Reading patterns in noisy lines
Curves from underground sampling rarely look smooth. Lines jump up and down, with sudden spikes, plateaus, and odd bumps. Analysts ask a guiding question: does this pattern make sense given how people live and move?
Daily habits shape the signal. Workdays, weekends, school breaks, and local events change how many people are present in a given catchment. When fewer people are around, a dip is normal. When a festival or large gathering brings more people together, a short-lived spike can be expected. Placing curves next to a calendar or clinic testing data often turns apparent noise into something understandable.
Looking at the shape of the line, not only its height, also helps. A slow, steady climb over several sampling dates usually carries more weight than a single sharp jump. A quick spike followed by an equally fast drop might point to a one‑off issue in sampling or lab workflow. Because of that, teams often flag any sudden change, then wait for one or two more samples before treating it as a reliable shift.
From curves to cautious decisions
To support real‑world decisions, signals need to be simple and transparent. One approach is to define bands such as “baseline”, “elevated”, and “high” for each target. Crossing from one band to another can trigger a closer look or a comparison with nearby sites.
In many situations, direction matters more than exact levels. Three or more points in a row heading the same way can justify measured responses, like reinforcing routine prevention messages. Over time, collecting results in a shared dashboard and agreeing on local rules for alerts helps turn a confusing curve into a familiar tool that decision‑makers can read at a glance.
Because these signals are only one piece of the puzzle, they are usually combined with hospital admissions and laboratory-confirmed cases.
Using Sewer Signals While Protecting People
Signals drawn from shared pipes can sound unsettling at first: infrastructure quietly carrying information about health, behavior, and community trends. The central point is that these signals do not need to become secrets about specific people in order to be useful.
How group‑level monitoring supports privacy
Work in this field focuses on large groups, not individuals. Samples are typically taken from treatment facilities or major collection points where contributions from many homes and buildings are thoroughly mixed. By the time the water reaches the lab, it is effectively impossible to link a result back to a single household, let alone a single person.
To add further safeguards, teams rely on aggregated data. Instead of mapping results to a single block or small building, they group results by wider service areas and longer time windows. A finding might simply state that a signal is rising across a district, or that resistance to a certain medicine appears more common in a broader region. That level of detail is usually enough to guide responses such as adjusting hospital capacity, planning outreach, or refining public messaging.
Anonymization practices also matter. Exact coordinates, very small catchment areas, and tiny sample sizes are either avoided or merged before sharing. When numbers are too small, results may be withheld or combined so they cannot be linked to a very small group. Teams often agree on clear rules in advance about when and how information can be shared with health departments, utilities, or the public.
The balance between insight and privacy can be thought of in terms of different design choices:
| Design choice | Privacy emphasis | Detail emphasis |
|---|---|---|
| Size of catchment area | Larger areas blur individual contributions and lower the risk of singling out groups. | Smaller areas can highlight local patterns but need extra safeguards and careful ethical review. |
| How results are shared | Broad categories and rounded values reduce re‑identification risks. | Finer-grained numbers and maps provide more precision but must be weighed against possible misuse or stigma. |
Q&A
-
What is wastewater epidemiology science and how does it complement traditional disease surveillance?
Wastewater epidemiology science uses pooled sewage samples to infer infection levels in a defined population, offering a cost‑efficient, anonymous snapshot of community health. It complements clinical surveillance by capturing asymptomatic and untested cases, smoothing reporting delays, and revealing broad pathogen trends that inform planning without requiring person‑level medical records. -
How can community health monitoring programs practically use environmental sampling basics?
Community health monitoring programs start by defining the population of interest, then applying environmental sampling basics such as representative site selection, composite sampling over time, and consistent handling procedures. These practices reduce random fluctuation, allowing authorities to compare locations, track seasonal shifts, and evaluate public health interventions, from vaccination campaigns to hygiene initiatives. -
Which sample analysis methods are most useful for detecting disease trends in wastewater?
Key sample analysis methods include concentration of solids, extraction of nucleic acids, and quantitative PCR or sequencing to identify specific pathogens and variants. Normalization to indicators like flow, fecal markers, or chemical tracers helps distinguish real disease trend detection from dilution effects, improving comparability between sites, dates, and changing environmental conditions. -
In what ways can public health data use from wastewater improve decision‑making?
Public health data use from wastewater strengthens situational awareness by offering early signals of emerging threats, validating or questioning clinic‑based trends, and guiding targeted communication. Authorities can prioritize testing resources, adapt infection‑control policies, and monitor intervention impact while reducing dependence on individual test uptake, access barriers, or shifting clinical testing guidelines. -
What ethical data considerations arise in wastewater epidemiology and how are they addressed?
Ethical data considerations include privacy, potential stigmatization of small communities, consent expectations, and governance of long‑term datasets. These are addressed through large catchment areas, aggregation, suppression of small‑number results, transparent communication, and oversight by ethics or community advisory boards that review new targets, reporting thresholds, and data‑sharing agreements.